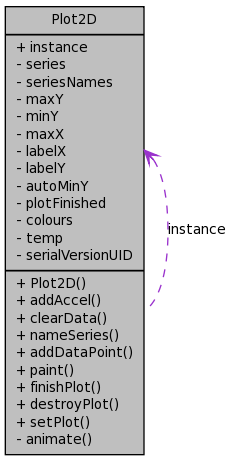
Plot2D Class Reference
Draws a simple line graph of one or more series of data. More...
Inherits javax::swing::JPanel.

Public Member Functions | |
| Plot2D () | |
| Creates a new blank graph with a number of series. | |
| void | addAccel (Accel3D a3d) |
Adds a new Accel3D to the graph. | |
| void | clearData () |
| Clears all currently plotted data leaving the plot clean. | |
| void | nameSeries (String name, int s) |
| Assigns a name to a series on the graph. | |
| void | addDataPoint (double value, int s) |
| Adds a data point to a given series on the plot. | |
| void | paint (Graphics g) |
| Paints the plot in the canvas. | |
| void | finishPlot () |
Creates a window with a JGraph in it to test the graph works correctly. | |
| void | destroyPlot () |
| Removes the static reference to Plot2D. | |
| void | setPlot (Vector< Accel3D > instance) |
| Sets the plot to a series of values. | |
Static Public Attributes | |
| static volatile Plot2D | instance = null |
| Reference to singleton object for easy access. | |
Detailed Description
Draws a simple line graph of one or more series of data.
The graph auto-scales the Y axis maximum, and can also be set to auto-scale the minimum axis.
Constructor & Destructor Documentation
| Plot2D | ( | ) |
Creates a new blank graph with a number of series.

Member Function Documentation
| void addAccel | ( | Accel3D | a3d | ) |
Adds a new Accel3D to the graph.
- Parameters:
-
a3d The acceleration sample to be plotted.


| void addDataPoint | ( | double | value, | |
| int | s | |||
| ) |
Adds a data point to a given series on the plot.
- Parameters:
-
value Value to be added s Series to which the new value is to be added.

| void clearData | ( | ) |
Clears all currently plotted data leaving the plot clean.

| void destroyPlot | ( | ) |
| void finishPlot | ( | ) |
Creates a window with a JGraph in it to test the graph works correctly.
Indicates an end of that gesture and prepares the plot for resetting.

| void nameSeries | ( | String | name, | |
| int | s | |||
| ) |
Assigns a name to a series on the graph.
- Parameters:
-
name The name of the series. s The number of the series.

| void paint | ( | Graphics | g | ) |
Paints the plot in the canvas.
It can be used to re-paint.
| void setPlot | ( | Vector< Accel3D > | instance | ) |
Sets the plot to a series of values.
Also animates the plotting of this data.
- Parameters:
-
instance The gesture to plot on this graph.

Member Data Documentation
The documentation for this class was generated from the following file:
- /Users/dev/Documents/SVN brazos.cs.tcu.edu/trunk/FROG/src/frog/gui/Plot2D.java


